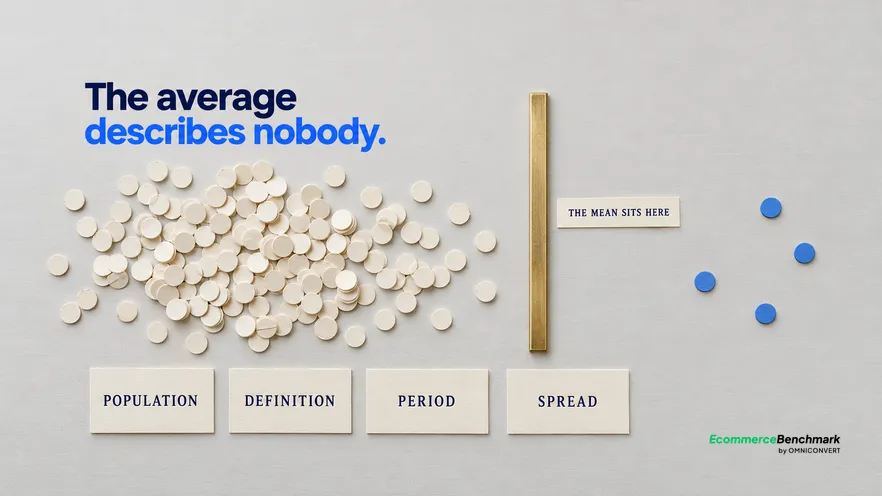
An industry benchmark is defined as a summary statistic drawn from a population of stores, which means it describes a distribution rather than a target. Four questions decide whether a published figure is comparable with yours at all: which stores it came from, what the metric actually counts, what period it covers, and what the spread looks like rather than the average. A figure that cannot answer all four is a headline. Even when it can, part of your distance from it is explained by your price position, assortment and traffic mix, none of which a test can change, so a gap is a question about headroom and never a goal.
- A benchmark describes a distribution. The average usually describes no individual store in it.
- Most disagreement between published figures is definition, not dispute: sessions against users, gross against net.
- Ask which quartile you are in. That answers the question the average was standing in for.
- A narrow benchmark from stores like yours beats a broad industry average every time.
- Never manage toward a benchmark. Part of the gap is your strategy working as intended.
Published benchmarks are the most quoted and least interrogated numbers in ecommerce. A figure appears in a report, gets screenshotted into a slide, becomes a target in a planning meeting, and nobody asks where it came from. Omniconvert has measured store performance across the CROBenchmark dataset of 7,000+ ecommerce sites against 248+ audit criteria over 13 years in eCommerce, and the single most common analytical error is not a bad benchmark. It is a good benchmark compared with a number that was calculated differently, drawn from a different population, over a different period. This piece gives the four questions that catch that before it reaches a roadmap.
Reading an industry benchmark, question one: which stores?
Start here because it disqualifies the most figures fastest. Ask what the population was and the answer is often unavailable, or a vague reference to a sample of retailers. A benchmark drawn from an unstated population cannot be compared with your store, because you cannot establish whether your store would have been in it.
When the population is stated, check it against yourself on four dimensions: category, revenue scale, market and business model. A conversion figure that pools single-product subscription brands with broad-assortment retailers describes a blend that exists nowhere, and the blend will sit somewhere between the two, flattering one and alarming the other.
Scale matters more than teams expect. A store doing a few hundred orders a month and one doing tens of thousands differ in traffic mix, brand awareness and repeat rate, all of which move every funnel metric. Comparing across that boundary is comparing businesses rather than funnels. The broader method for building a picture of stores genuinely like yours is in the DTC competitor research stack.
Question two: what does the metric actually count?
This is where two credible sources can both be right and still look irreconcilable. Work through the choices explicitly.
- Denominator. Sessions or unique users. A user-based rate is higher than a session-based one, often substantially, because people visit several times before buying.
- Numerator. Orders, transactions or units. And whether returns are netted off, which matters enormously in apparel and barely at all in consumables.
- Traffic filtering. Whether non-human traffic was excluded. An unfiltered denominator depresses every rate built on it, and the degree varies by store.
- Attribution window. Whether a purchase is credited to the session it happened in or to an earlier one, which moves device-level figures most of all.
Then check your own definitions against the same list, honestly. A surprising share of benchmark anxiety dissolves at this step: the store was measuring sessions against a user-based published figure and had been worrying for two quarters about a gap that was arithmetic. Shopify's own analytics documentation is explicit about how its sessions are defined and when they reset, which is exactly the sort of primary source worth reading once rather than assuming.
Question three: what period, and does it include a peak?
Find the window. If it is not stated, treat the figure as unusable for a point comparison, because the seasonal swing in most categories is larger than the difference between a good store and a mediocre one.
Where the period is stated, compare like with like: your November against their November, your full year against their full year. This sounds obvious and is routinely violated, usually because the benchmark arrives in a planning cycle and gets compared against whatever your most recent month happened to be.
There is a subtler version worth watching for. A benchmark published annually but gathered in a specific quarter carries that quarter's conditions permanently, and nothing in the headline says so. The method section is where this is visible, which is the main argument for reading it.
Question four: what is the spread?
This is the question that changes how a benchmark is used rather than merely whether it applies. A reported average of some figure might come from a population where most stores sit well below it and a small number sit far above. Managing toward that average means chasing a position almost nobody in the population holds.
The quartile framing is better in every way. Knowing you are in the second quartile tells you there is real room above you and roughly how much. Knowing you are in the top quartile tells you that further funnel work has a smaller ceiling than, say, improving your repeat rate would, which is a genuinely different strategic conclusion.
It is also more robust to the first three questions. Quartile position is less sensitive to definitional drift than an absolute figure, so even an imperfectly matched benchmark can tell you something useful about where you sit. The Baymard Institute and its published research on funnel usability is a useful companion here, because it describes the kinds of defects that typically separate quartiles rather than offering a single number to aim at.
| What to check | The question to ask | If it is missing | Why it moves the figure |
|---|---|---|---|
| Population | Which stores, how many, which markets | Unusable for comparison | Business models average together |
| Denominator | Sessions or unique users | Assume the higher reading | User-based rates run higher |
| Numerator | Orders gross or net of returns | Unusable in high-return categories | Returns can be a large share |
| Bot filtering | Was non-human traffic excluded | Treat as depressed | Unfiltered traffic inflates the denominator |
| Period | Which window, peak included | Unusable for a point comparison | Seasonality exceeds store quality |
| Spread | Median and quartiles, not the mean | Ask, or discount the average | Long tails pull the mean upward |
| Your own definitions | Do they match all of the above | Fix this first | Most benchmark gaps start here |
The last row is where to begin in practice. Checking your own measurement definitions against a published method costs an hour and resolves a respectable share of benchmark worry without any work on the store at all.
What a gap can and cannot tell you
Suppose you have done all four checks and a real gap survives. The useful next move is to subtract the part your strategy accounts for. A premium brand with deliberately higher prices will convert below a value-led population and should: that difference is the strategy operating, not a defect.
What remains after that subtraction is your workable headroom, and its size relative to other gaps is the only ranking worth having. A modest unexplained gap on a step carrying most of your traffic is worth more than a dramatic one on a step almost nobody reaches.
Two cautions on the way this goes wrong in practice. Benchmarks arrive in planning cycles and get adopted as targets because a target is what the cycle wants, so the subtraction step gets skipped under time pressure. And a gap on a metric you cannot influence, such as average order value in a fixed-price category, produces discounting as the only available lever, which closes the gap and loses money. For the strategic frame on which gaps are worth closing at all, Omniconvert's work on customer value optimization treats the question as a profit ranking rather than a comparison exercise.
What to do this week
- Document your own definitions. One page: what your conversion rate counts, over what window, with what filtering. This is the artefact every future comparison depends on.
- Interrogate the figure you currently quote. Whichever benchmark is in your planning deck. Run the four questions. Expect at least one to fail.
- Get a position rather than a number. A free leaderboard score on ecommercebenchmark.ai places your store against real competitors in your category and country across six dimensions, including AI visibility and agentic commerce readiness, which no published average covers at all. The paid audit report goes a level deeper per dimension. Once you know where the store ranks, Nexus by Omniconvert, the AI for eCommerce growth engine, identifies which metrics to prioritise and queues the experiments most likely to close the gap, and you approve what goes live.
- Keep the comparison narrow. Benchmarked against stores like yours, not against an industry. The narrower comparison is less comfortable and more useful.
- Re-read the definition page before each planning cycle. It takes two minutes and it is the step that stops a definitional gap being adopted as an objective.
For the wider question of what competitive intelligence is for, and where benchmark reading sits inside it, see competitive intelligence for eCommerce?. Statista's retail data publications are a reasonable example of a source that states its method clearly, which is the quality worth looking for rather than any particular figure.
Frequently asked questions
How do you read an industry benchmark without being misled?
Establish four things before you compare it with anything of yours: which stores the figure came from, exactly what the metric counts, what period it covers, and what the spread looks like rather than the average. A published figure that cannot answer all four is a headline rather than a benchmark. Once it can, treat any gap as a question about where your headroom might be, never as a target to hit.
Why are published conversion rate benchmarks so inconsistent?
Mostly because of definition rather than disagreement. One source counts sessions, another counts users; one counts orders gross, another nets off returns; one excludes bot traffic, another does not; one covers a peak quarter, another a full year. Each choice moves the figure, and stacked together they can move it by a factor. Two credible sources can both be right and still publish numbers that look irreconcilable.
Should you use the average or the median?
The median, and then the quartiles. Store performance distributions have long tails, so a handful of exceptional stores pull the mean well above where most of the population sits, and the resulting average describes nobody. Knowing which quartile you occupy tells you how much room is realistically above you, which is the only thing you wanted the comparison for.
What makes a benchmark actually useful?
Being drawn from stores genuinely like yours, on a metric defined the way you define it, and reported as a distribution with the method stated. A narrow, well-defined benchmark from a smaller population beats a broad industry average every time, because the broad average contains business models that have nothing to do with yours and quietly averages them into your target.
What should you never do with a benchmark?
Set it as a goal and manage toward it. A benchmark is a description of other people, and part of your distance from it is structural: your price position, your assortment, your delivery proposition and your traffic mix. Managing to close a gap that your strategy explains produces decisions that damage the business, usually by discounting toward an average you were deliberately not trying to be.
The bottom line
A published benchmark is a distribution reported as a number, and four questions decide whether it describes stores like yours: the population it came from, what the metric counts, the period it covers, and the spread behind the average. Run them on whichever figure is currently sitting in your planning deck and expect at least one to fail. Then do the step everyone skips: document your own definitions, so the next comparison starts from matched arithmetic rather than from a gap that was never real. What survives all of that is a question about headroom, which is useful, and never a target, which is not.