

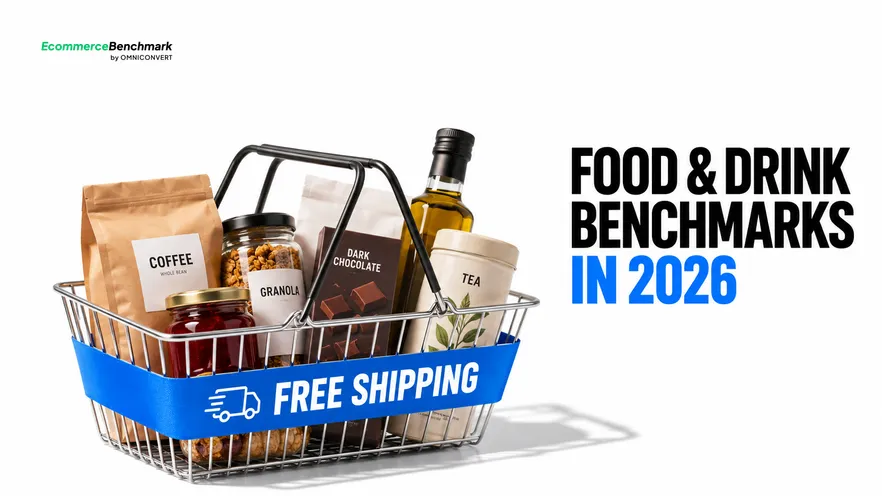
A threshold effect is defined as the concentration of basket-building behaviour around a free-shipping minimum, which in low-value orders decides conversion more than the product pages do. Ad and conversion benchmarks for food and drink brands mislead without it, because shipping is a large share of a small basket. Unexpected cost is the most cited reason behind cart abandonment, which affects around 70% of carts [Baymard Institute, 2025]. This guide covers the four adjustments that make a food and drink benchmark readable, and what to measure instead of a borrowed average.
- Measure how many baskets stall below the free-shipping minimum.
- Split first-order conversion from replenishment, which flatters the blend.
- Remove traffic outside your delivery area from the denominator.
- Treat the chilled or frozen delivery window as part of the offer.
- Compare against real competitors in your category and country.
- Score AI visibility and agentic commerce readiness, which benchmarks omit.
The CROBenchmark dataset covers 7,000+ websites across 15+ industries, evaluated against 248+ audit criteria, drawing on 13 years in eCommerce and 70,000+ experiments, all measured by Omniconvert [CROBenchmark Report 2026, Omniconvert]. Food and drink is the vertical where the largest single conversion lever is usually a number in the shipping settings rather than anything a designer can touch.
Why ad and conversion benchmarks for food and drink brands mislead
We publish industry figures separately, and this page deliberately does not restate a food and drink percentage, because a number without the adjustments below is worse than no number. It points a team at the product pages when the constraint is in the basket.
Consider what sits inside a published grocery conversion average. A coffee subscription with a mature repeat base contributes to the same figure as a hamper retailer whose entire year happens in December. Their traffic is differently decided before it arrives.
For the method that applies across all verticals, see the DTC competitor research stack. The creative angle on that same data is in turning findings into creative tests.
Adjustment one: read conversion against the shipping threshold
Watch the behaviour and the mechanism is obvious. A shopper wants one thing, sees the delivery charge, and either builds a basket to clear the free-shipping minimum or abandons because paying a courier more than the product costs feels absurd.
That produces a measurable signature: a cluster of baskets sitting just below the threshold and never completing. Those are not page failures. They are shoppers who wanted to buy and could not make the arithmetic work.
Unexpected cost has been the most frequently cited reason shoppers abandon a purchase for as long as Baymard Institute has measured it, at around 70% average cart abandonment [Baymard Institute, 2025], and in this category that cost is the delivery charge on a small order.
So measure it directly. Count the baskets that stall below the minimum and their average distance from it. A bundle priced to close that gap frequently moves more revenue than a quarter of page work.
Adjustment two: split replenishment from acquisition
Food and drink is a repeat category, and repeat traffic converts at a rate a first-time visitor cannot approach. A shopper reordering coffee they already drink is not making a decision at all.
That means a blended conversion rate is largely a measure of how much of your traffic is returning. Grow the customer base and the rate rises on its own, which feels like progress and tells you nothing about acquisition.
It also conceals the reverse. A store running a successful acquisition quarter fills its traffic with undecided first-time visitors and reports a falling conversion rate while the business improves.
A 5% improvement in retention can raise profits by 25% to 95% [Harvard Business Review, 2014], which is why the repeat half deserves its own benchmark rather than being hidden inside the headline. The same split in a neighbouring replenishment category is covered in ad & conversion benchmarks for supplements brands.
Adjustment three: exclude traffic you cannot deliver to
This adjustment is specific to the category and routinely missed. A chilled or frozen range needs a delivery network that reaches a narrower area than the marketing does, so a share of every campaign's traffic is structurally unconvertible.
Those visitors sit in the conversion denominator forever. No page improvement reaches them, and their presence makes the store look worse than it is while hiding how well it performs where it can actually trade.
The fix has two halves. Report conversion on serviceable traffic so the figure measures the store, and stop paying to acquire traffic outside the network, which in most accounts is a straightforward targeting correction with an immediate payback.
| Adjustment | What it corrects | Without it |
|---|---|---|
| Measure the shipping threshold | Baskets stalling below it | Page work aimed at a pricing gap |
| Split repeat and first order | Repeat traffic flattering the blend | Acquisition judged on the wrong rate |
| Exclude unserviceable traffic | Visitors you cannot deliver to | Store looks permanently worse |
| Account for delivery windows | Day constraints in the offer | Loss attributed to price |
| AI visibility score | Discovery you cannot see | Absent from assistant shortlists |
| Agentic readiness score | Automated reorder eligibility | Skipped before price is read |
The way food teams most often get burned here is by running a conversion programme against a national traffic figure while trading on a regional delivery network. The brand launches chilled delivery across part of the country, marketing runs nationally because that is how the channels are set up, and the conversion rate settles well below the industry average everybody quotes. A redesign is commissioned, then a checkout rebuild, then a round of page-speed work, and the rate barely moves, because a large share of the traffic lives in postcodes the courier does not serve and leaves at the delivery step every time. The data to see this exists in the postcode field of every abandoned checkout, and nobody reads it, because the abandonment looks like ordinary checkout friction.
Adjustment four: compare against the right competitors
Country moves this benchmark through logistics more than through taste. Delivery density, courier cost, what counts as a normal delivery charge and whether chilled delivery is commonplace all vary by market and all change the threshold arithmetic.
Category mix moves it again. Ambient staples, chilled fresh, frozen, alcohol and gifting have different basket sizes and different regulatory positions, and a store spanning them has an internal spread wider than most published ranges.
So the comparison worth building is narrow. The eCommerceBenchmark score gives you that reading across six dimensions: Creative and Ads, AI Visibility, Reviews and UGC, Agentic Commerce, Competitor Synthesis and CRO. A free leaderboard entry shows where you stand against peers; the paid audit report, $19.99 at launch against a $99.99 base price, adds the breakdown at dimension level.
The two dimensions standard benchmarks ignore
All of the above applies to visitors who already landed on your site. A growing share of food discovery now happens inside a generated answer, and the filtering question is usually about what a product does not contain.
That makes published allergen and ingredient data a discovery asset rather than a compliance chore. A brand whose exclusions are readable gets shortlisted on the dietary queries that dominate this category, and one whose label is only a photograph does not.
Check each competitor in the Meta Ad Library alongside this data: ad longevity is the strongest public signal of what is performing for them [Meta, 2026]. The guide on spotting which competitor ads are actually working explains how to interpret that signal.
Adding a 'New' badge to newly launched products, AliveCor ran one Omniconvert A/B test across all devices and recorded a +25.17% conversion rate, +29.58% revenue per user, and a 99.4% chance to win. [Omniconvert, AliveCor case study] That is a testing result rather than a benchmark result, and the transferable discipline is to read revenue per visitor beside conversion, which in food is the pair that shows whether a threshold change grew baskets or simply gave away delivery.
What to do this week
- Count baskets below the threshold. And their average distance from it.
- Split repeat from first order. Two conversion series, by channel.
- Read the abandoned postcodes. Measure unserviceable traffic.
- Take a free leaderboard reading. Against competitors in your category and country.
Once basket economics, delivery cost and repeat behaviour have to be read in one place, that becomes a data problem rather than a reporting one. Omniconvert Commander (formerly Nexus) is an AI for eCommerce growth engine that brings commerce data together, runs experiments ranked by True Profit, and produces campaigns and creative that go live only after you approve them. Once your ranking is clear, it pinpoints which metrics to address and lines up the experiments best suited to close that gap. The adjacent vertical, where returns rather than shipping thresholds distort the figures, is ad & conversion benchmarks for fashion brands.
Frequently asked questions
What are useful ad and conversion benchmarks for food and drink brands?
Only ones that separate first orders from replenishment and are measured against a comparable shipping threshold. A blended grocery average mixes subscription-heavy stores with gift and hamper sellers, so it cannot tell you whether your number is good. To get a meaningful number, compare against actual competitors operating in your category and country.
What is the threshold effect?
It is the concentration of basket-building behaviour around a free-shipping minimum. Food orders are low in value and shipping is a large share of them, so shoppers add items until delivery becomes free or abandon when they cannot justify it. That makes the conversion rate depend more on where the threshold sits than on the product pages.
Why exclude traffic outside the delivery area?
Because no page change can convert it. A chilled or frozen brand serves a narrower area than its marketing reaches, so visitors outside that area sit in the denominator permanently and depress a rate they can never contribute to. Removing them makes the remaining figure a measure of the store.
Does a high repeat rate flatter the conversion rate?
Yes, substantially. Replenishment visitors arrive already decided, so a store with a mature customer base reports a higher blended rate than a store of the same quality acquiring new customers. Splitting the two shows whether acquisition is actually working, which a blended figure conceals in both directions.
Which dimensions do standard benchmarks miss?
AI visibility and agentic commerce readiness. Both shape whether an AI assistant includes your products in a shortlist for a shopper, and both can be checked from outside your store. Neither metric appears in a standard benchmark set, so a brand can look strong on conventional scores while missing entirely from the pre-purchase comparisons that matter now.
Where should a food and drink brand start?
By measuring how many baskets stall below the shipping threshold, then splitting conversion between first orders and replenishment. Those two steps usually show that the largest available gain is a threshold or bundle change rather than anything on the product pages.
Measure the gap to free delivery
Take last quarter's abandoned baskets and work out how many stalled below your free-shipping minimum and by how much. It is a single query, and in most food and drink accounts it identifies a larger available gain than any page test on the roadmap, because it names a pricing gap rather than a design problem.
Then read the postcodes on those abandonments to size the traffic you cannot deliver to, and take a free leaderboard reading so the comparison is against competitors with comparable shipping economics. Any actionable benchmark is specific by nature, and no other scoring system measures both AI visibility and agentic commerce readiness, the two dimensions most likely to matter next year.