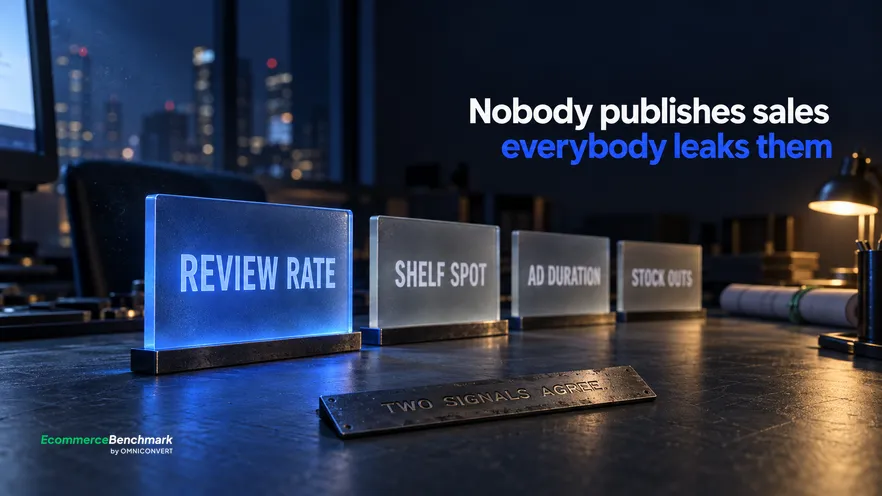
A demand signal is defined as a publicly observable behaviour of a store that correlates with how well a product sells, and four of them together are how to find a competitor's best-selling products without any sales data at all. Review velocity: the change in a product's review count across two weeks, which beats the total count decisively. Merchandising position: a store eventually promotes what converts. Advertising persistence: continuous spend on one product implies it pays back, because losing advertisements get switched off. And stock behaviour: a variant that keeps selling out signals demand that outran the forecast. Each signal alone has a failure mode that produces false positives. Where two independent signals agree on a product, the inference is sound.
- Review velocity, not review totals. Record counts on two dates, two weeks apart.
- Read advertising duration rather than intensity. Persistence implies payback.
- Merchandising position reflects margin as well as sales. Treat it as one vote.
- Repeated stock-outs on one variant are a demand signal, or a supply problem.
- Trust a product only where two independent signals agree on it.
To find a competitor's best-selling products you have to infer them, because no store publishes unit sales and nothing is going to change that. Omniconvert has measured commercial behaviour and page performance across 70,000+ experiments and 13 years in eCommerce, and the useful discovery about competitor demand research is that stores leak the answer continuously through four ordinary public behaviours. Nexus by Omniconvert is the AI for eCommerce growth engine that unifies commerce data, prioritises experiments by True Profit and generates campaigns and creative you approve before they go live, and the relevant discipline it shares with this method is the same one: a single indicator is a guess and two agreeing indicators are a finding. Last updated: October 2026.
This article covers the demand axis. For the full set of axes, see the DTC competitor research stack, for the commercial axis analyse a competitor's pricing and offers, and for the language axis benchmark your messaging against competitors.
Why you cannot find a competitor's best sellers by looking once
This is the mistake that makes most competitor product research useless, and it is entirely avoidable.
Open a competitor's category page and sort by review count, and you will get a list of their oldest successful products. Reviews accumulate and never decay, so the ranking you are looking at is a record of what sold well across the whole life of the catalogue. It is genuinely interesting and it is not the question you asked.
The fix is to measure a rate rather than a level. Record the review count on every product in the category today, record it again in two weeks, and subtract. What you now have is a ranking of current demand, because the proportion of buyers who leave a review is broadly stable within a single store even though it varies a lot between stores. That stability inside one store is what makes the comparison valid.
Shopify's own product and inventory documentation is worth a read before you start, because it sets out which product fields a Shopify storefront exposes publicly, and that list is the practical limit on what any of these signals can see. Baymard Institute's product-page research is the other useful reference here, for a different reason: it documents how often shoppers rely on review content at the point of decision, which is the behavioural basis for review velocity working as a proxy at all.
Two weeks is the working interval. Shorter and the differences are swamped by noise on all but the highest-volume products. Much longer and you lose the ability to notice a change in the category, which is frequently the most valuable thing the exercise produces.
The four signals that reveal best-selling products
Taking them in order of reliability.
Review velocity. The strongest single signal and the most work to collect, which is the usual trade. Its failure mode is review solicitation: a store running a review campaign, or incentivising reviews on one product, will show velocity unrelated to sales. You can often spot this because the velocity jumps across the whole catalogue at once rather than on one product.
Merchandising position. Which products sit in the first row of the category page, on the home page, in the navigation. Cheap to collect and genuinely informative, because a store eventually learns what converts and promotes it. Its failure mode is that position also reflects margin, inventory position and a buying commitment, so a heavily promoted product may be the one they need to move rather than the one that sells itself.
Advertising persistence. Available publicly: Meta's Ad Library shows what an advertiser is running and for how long, and reading it for duration rather than volume is the whole technique. Advertising that loses money is switched off, so a product advertised continuously for two months is very likely paying back. Its failure mode is a brand or launch commitment that keeps spend running on strategy rather than on return.
Stock behaviour. Which variants go out of stock and how fast they return. A size or colour that repeatedly sells out is demand that outran a forecast, which is a strong signal. Its failure mode is the obvious one: a stock-out can be a supply failure, and a long absence is more likely supply than demand.
| Signal | What it actually measures | Its failure mode | Cost to collect |
|---|---|---|---|
| Review velocity | Current relative sales volume | A review-solicitation campaign | Highest, two timed passes |
| Merchandising position | What the store believes converts | Margin or stock they need to move | Low, one screenshot |
| Advertising persistence | What is paying back on spend | A brand or launch commitment | Low, a public ad library |
| Stock behaviour | Demand against their forecast | A supply failure, not demand | Moderate, repeat checks |
| Review totals | Catalogue history, not now | Mistaken for current demand | Lowest, and least useful |
| Any two agreeing | A product you can act on | Failure modes are independent | The output worth keeping |
The last row is the method in one line. Because each signal fails for an unrelated reason, two signals agreeing on the same product is a far stronger result than either signal being individually strong.
Reading advertising persistence properly
This signal is the cheapest of the four to collect and the most commonly misread, so it is worth being specific.
The instinct is to count: this competitor is running fourteen advertisements for product A and two for product B, therefore A matters more. Sometimes true, and frequently it records that A was launched last week with a large creative test behind it. A product in its test phase gets many variants and a short history.
The better reading is temporal. For each product, note the earliest date you can see a creative running and whether it is still running now. A product with spend behind it continuously across two months has survived every weekly review in that period, and advertising that is not working does not survive those reviews. One advertisement running for ten weeks is a stronger signal than twelve running for five days.
Meta's own advertising documentation is worth reading on how campaign objectives shape what gets scaled, because a product kept running under a purchase objective is a much stronger demand signal than one kept running under a traffic or awareness objective. Where the library shows you enough to tell, the distinction is worth recording.
What a growth lead should do this fortnight
- Pick three competitors and keep them. The two shoppers compare you with most, plus one that is growing. The method depends on repeat observation, so breadth is the enemy here.
- Record review counts today, for the whole category. Product name and number, in a sheet, with the date. This is the pass that makes the next one meaningful.
- Screenshot the category and home page. First row, hero placements, navigation. Merchandising position is free to capture and easy to forget.
- Check the ad library for first-seen dates. Per product, not per advertisement. Duration, not volume.
- Get your free benchmark score. Ecommerce Benchmark scores your store across six dimensions, including AI Visibility and Agentic Commerce, against real competitors in your category and country, which tells you whether your own product mix is the weakest of the six or a distraction.
Then come back in two weeks, subtract, and write down only the products that two independent signals agree on. Where your own order, margin, advertising and stock data sit in four systems and have to be assembled before you can even compare your mix with what you just learned about theirs, that unification is what Nexus addresses, with every proposed campaign staying something a person approves before it goes live.
FAQ: finding a competitor's best sellers
How can you find a competitor's best-selling products?
Infer it from four public signals rather than looking for a sales figure that is never published. Review velocity, which is the change in a product review count over two weeks. Merchandising position, because a store eventually promotes what converts. Advertising persistence, since continuous spend on one product implies it pays back. And stock behaviour, because repeated stock-outs signal demand that outran a forecast. Each is weak alone. Where two agree, the inference is sound.
Why is review velocity better than total reviews?
Because a total is a record of history and a velocity is a measurement of now. A product launched three years ago may carry the largest review count in the catalogue while selling almost nothing today, and a product launched last quarter may be the store best seller with a tenth of the reviews. Recording counts on two dates two weeks apart separates the two cases completely, and it is the single highest-value habit in competitor demand research.
What does advertising persistence actually tell you?
That the product is probably paying back, which is a stronger signal than the volume of advertising. A burst of spend on a product means somebody decided to test it. Continuous spend on the same product across many weeks means the test kept passing, because advertising that loses money gets switched off. Read duration rather than intensity, and treat a newly launched campaign as a hypothesis rather than as evidence.
What is the failure mode of each signal?
Review velocity is distorted by review-solicitation campaigns and by incentives on specific products. Merchandising position reflects margin and strategy as much as sales, so a promoted product may simply be the most profitable. Advertising persistence can indicate a brand or launch commitment rather than payback. Stock-outs can mean a supply problem rather than demand. Each failure mode is independent of the others, which is exactly why agreement between two signals is trustworthy.
How many competitors should you track this way?
Three, and the same three each time. The method needs repeat observation, so breadth costs you the thing that makes it work. Pick the two competitors shoppers compare you with most often and one that is growing, record the four signals on a fixed fortnightly cadence, and keep the sheet. Six observations across three stores is a genuine picture of where category demand is moving, and it takes well under an hour per round.
The bottom line
Nobody publishes unit sales, and you do not need them. Four ordinary public behaviours leak the answer, and the discipline that makes them useful is the one most competitor research skips: measure a rate, not a level, and never trust one signal. Record review counts across the whole category today and again in a fortnight, because the change is the ranking you wanted and the total is a history lesson. Screenshot where the store puts things. Read the ad library for how long a product has been advertised rather than how loudly. Watch which variants keep selling out. Then write down only the products that two independent signals agree on, since each signal fails for its own unrelated reason and agreement is what cancels that out. Three competitors, a fixed fortnightly cadence, one sheet kept over time. That sheet, six months in, tells you where demand in your category is moving before it shows up in anybody's commentary.