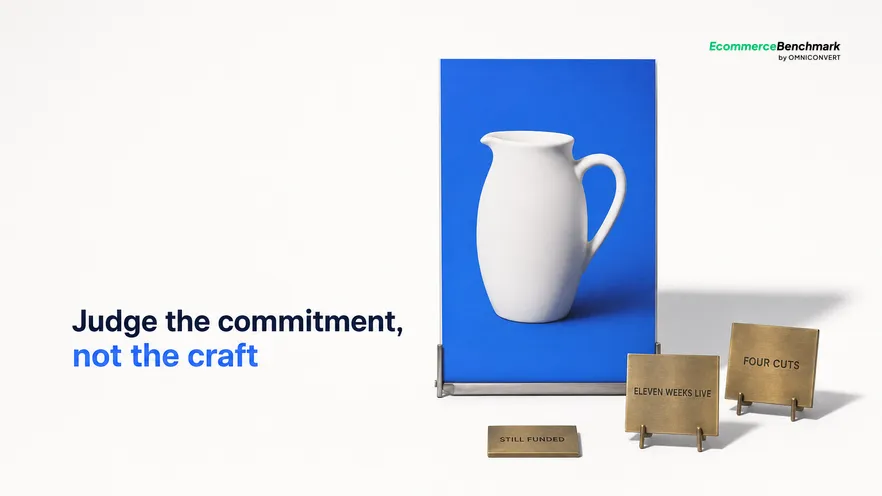
To spot a winning ad, stop assessing the creative and start assessing what its advertiser has committed to it since launch. Five things are observable from outside the account, and none of them is aesthetic: how long it has been running, how many cuts of the same concept exist, how many placements and formats it has spread into, whether localised versions have appeared, and whether the advertiser has begun producing near copies of its own idea. Each one costs money that nobody spends on a creative that is losing. Together they separate a scaler from a test with reasonable confidence. What you cannot see is why it works, because the offer, the audience and the landing page sit outside the frame, which is why copying the execution fails so reliably.
- Judge the commitment, not the craft: what an advertiser funded after launch is the only visible evidence.
- Run length is the strongest single signal and the easiest to misread on its own.
- Extra aspect ratios, new placements and localised versions all cost money a test never gets.
- Every signal is a change over time, so a one-sitting sweep can only assess aesthetics.
- Copy the structure of the argument; the execution depends on an offer and an audience you cannot see.
Most attempts to spot a winning ad fail in the first five minutes, because the person doing it opens an ad library and starts forming opinions about the creative. The creative is the one part of a winning ad that carries almost no information about whether it won. What carries the information is what the advertiser did next. Last updated: September 2026.
Omniconvert has measured storefront and creative practice across the CROBenchmark dataset of 7,000+ websites in 15+ industries, against 248+ audit criteria, over 13 years in eCommerce, with conversion behaviour measured across 70,000+ experiments and 2,500+ Shopify stores. The consistent finding about creative is uncomfortable for anyone who enjoys judging it: the assets that perform are frequently not the ones a marketing team would have chosen from a wall of options, and the ones a team admires are frequently the ones that quietly stopped running.
This piece gives you the five signals, the order to read them in, and the traps in each. For the wider apparatus this sits inside, see the DTC competitor research stack. For scoring an individual creative once you have decided it is worth scoring, there is the Winning-Ad scorecard.
How to spot a winning ad: watch the commitment, not the craft
The logic is simple and worth stating plainly because it is what makes external research possible at all. You cannot see anyone's return on ad spend. You can see the consequences of it, because good results produce spending and spending leaves traces in what is publicly visible.
This reframes the research task. You are not evaluating creative quality, which you are not equipped to do from outside and which does not predict performance anyway. You are looking for evidence of a decision somebody made with data you do not have.
It also explains why the exercise fails without a log. Every signal below is a difference between two observations. With one observation you have a snapshot of a library, and a snapshot can only be judged on how things look, which returns you to the mistake.
There is a second, less obvious reason this framing is worth adopting, which is that it makes the research falsifiable. An opinion about whether a creative is good cannot be checked and cannot be handed to a colleague. A dated record saying that one concept has run for eleven weeks, exists in four cuts and has appeared in a second language is a claim somebody else can verify and disagree with. Research that can be argued about accumulates. Research that consists of taste does not, which is why most competitor-creative work quietly stops after a quarter with nothing carried forward.
The five Scaling Signals
- Run length. How many weeks the creative has been live. The strongest single signal, and the one most often read without support. An ad running for months has survived decisions.
- Variant count. How many cuts of the same concept exist: different lengths, different aspect ratios, different opening seconds. Re-editing is production spend committed after the result was known.
- Placement spread. Whether the concept has appeared in additional placements and formats. Somebody with access to the numbers has widened its budget.
- Localisation. Whether translated or market-specific versions exist. Localisation is slow, expensive and never speculative, so it is the closest thing to confirmation available from outside.
- Self-imitation. Whether the advertiser has started producing variations on its own concept. A brand copying itself has found something it wants more of.
Two signals agreeing is worth far more than one signal being strong. A creative with a long run and no variants may simply be an always-on placement nobody reviews. The same creative with a long run, four cuts and a localised version is a scaler, and you can act on that without ever seeing a number.
One practical note on the second signal, because it is the one most often miscounted. A variant is another cut of the same argument, not another creative in the same campaign. Three unrelated concepts running together is a test in progress, and it is the opposite of the signal you are looking for. Three edits of one concept, with the same opening claim in different lengths, is the signal. Getting that distinction wrong turns the strongest available evidence into the weakest, and it is the single most common error in a log that has been kept diligently and read badly.
What each signal is worth, and how it misleads
| Signal | What it implies | Evidential weight | Characteristic false positive |
|---|---|---|---|
| Run length | It survived review cycles | High, alone unreliable | An always-on or forgotten campaign |
| Variant count | Production spend after launch | High | An agency retainer producing cuts anyway |
| Placement spread | Budget was widened | Moderate to high | An automated placement setting |
| Localisation | Committed cross-market spend | Very high | A scheduled market launch, not this creative |
| Self-imitation | The advertiser wants more of it | Very high | A seasonal template reused annually |
| Production value | Nothing about performance | None | Mistaking budget for results |
The last row is in the table because it is what most people are actually using. Polish tells you what an advertiser can afford, not what worked, and plenty of the highest-performing creative in eCommerce looks as though it was shot on a phone in a stockroom, because it was.
What you cannot see, and why copying fails
The offer. A bundle, a guarantee, a trial period or a delivery promise can carry an otherwise ordinary creative entirely. You will often not know the offer exists.
The audience. The same asset shown to a warm list and to cold prospecting produces completely different numbers. What you are looking at may be a retargeting creative that works because of who sees it.
The landing page. Half the performance of an ad is the page behind it, and the page is the half nobody screenshots. Meta's own guidance to advertisers has long emphasised the match between creative promise and destination [Meta].
The price. An advertiser with a structurally lower cost base can run creative that would lose money for you at the same conversion rate. Nielsen's long-running work on advertising effectiveness has consistently found creative to be one contributor among several rather than the whole explanation [Nielsen].
So copy the structure and rebuild the rest. What transfers is the shape of the argument: which objection is answered first, how soon the product appears, whether evidence precedes the claim or follows it. Those are decisions you can reuse. The wording and the aesthetic are not.
What to do this month
- Start a dated log today. Five competitors, one row per creative, first-seen date and a link. The log is worth more than any single reading you could take from it.
- Check it fortnightly, not daily. The signals move on a scale of weeks. Daily checking produces noise and abandons the habit inside a month.
- Record placements and cuts, not opinions. Countable fields only. An opinion column will quietly become the whole log.
- Write down the structure of the two strongest. One line each on what the argument does in order. That is the transferable part.
To see how your own creative and ads dimension compares with real competitors in your category and country, the free Ecommerce Benchmark score covers Creative and Ads alongside Reviews and UGC, AI Visibility, Agentic Commerce, Competitor Synthesis and CRO, and the paid report goes into where each score came from. Once you know which dimension is furthest behind, Nexus by Omniconvert is an AI for eCommerce growth engine that unifies commerce data, prioritises experiments by True Profit, and generates campaigns and creative you approve before they go live, which is how a research habit turns into a queue of experiments rather than a folder of screenshots.
The bottom line
Competitor ad research has a bad reputation among people who have tried it, and the reason is almost always that they did it in one sitting. Opening a library and scrolling through a competitor's creative feels like research and produces nothing, because the only thing visible in that moment is what things look like, and what things look like is the one variable with no predictive value. Every signal that does predict something is a difference between two dates. So the whole discipline reduces to an unexciting instruction: start writing down what you see, with the date, before you have any opinion about it. Three weeks later you will be able to tell a scaler from a test with more confidence than any amount of staring at the assets could ever give you, and you will have stopped copying the executions that were never the reason.